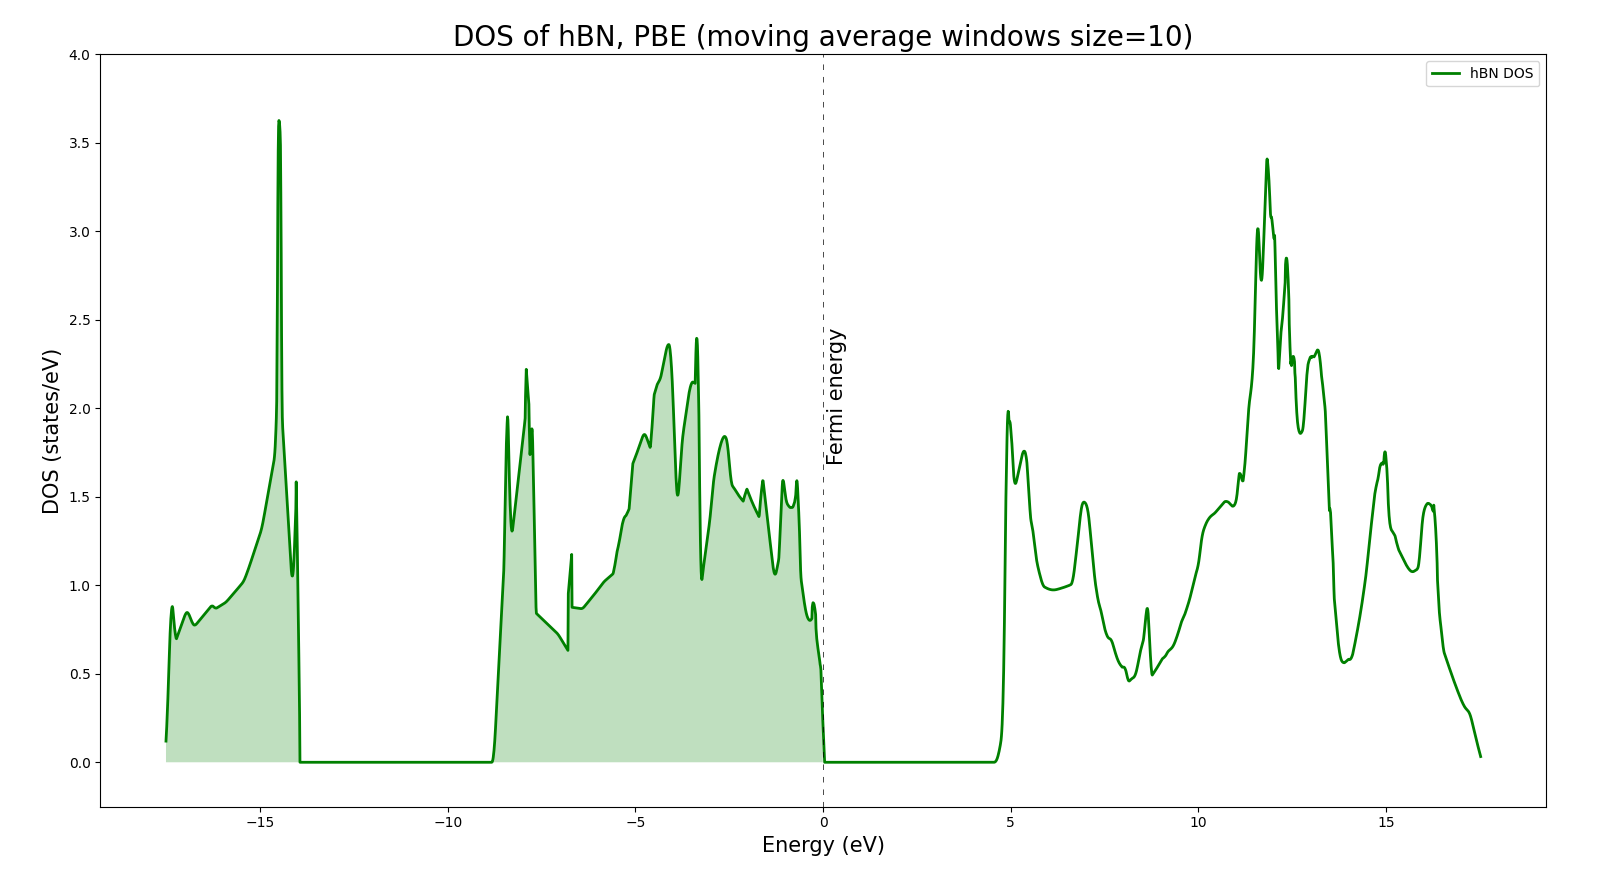
&CONTROL
  calculation = 'scf'
  outdir = './out/'
  prefix = 'hBN'
  pseudo_dir = '.'
/
&SYSTEM
  ecutwfc = 80
  ecutrho = 440
  ibrav = 0
  nat = 4
  ntyp = 2
  smearing='gauss'
  occupations='fixed'
  degauss=0.01
  nbnd=16
/
&ELECTRONS
  conv_thr =   1.0d-10
  !startingpot='file'
  !startingwfc='file'
/
ATOMIC_SPECIES
B     10.0 B_pbe_v1.01.uspp.F.UPF
N     14.0 N.oncvpsp.upf

ATOMIC_POSITIONS crystal
B            0.6666666667       0.3333333333       0.7500000000
B            0.3333333333       0.6666666667       0.2500000000
N            0.6666666667       0.3333333333       0.2500000000
N            0.3333333333       0.6666666667       0.7500000000

CELL_PARAMETERS angstrom
     -1.2562141150      -2.1758266724      -0.0000000000
     -1.2562141150       2.1758266724       0.0000000000
      0.0000000000       0.0000000000      -7.7072650000

K_POINTS automatic
10 10 10 0 0 0
NSCF Input:
&CONTROL
  calculation = 'nscf'
  outdir = './out/'
  prefix = 'hBN'
  pseudo_dir = '.'
/
&SYSTEM
  ecutwfc = 80
  ecutrho = 440
  ibrav = 0
  nat = 4
  ntyp = 2
  smearing='gauss'
  occupations='tetrahedra'
  degauss=0.01
  nbnd=16
/
&ELECTRONS
  conv_thr =   1.0d-10
  !startingpot='file'
  !startingwfc='file'
/
ATOMIC_SPECIES
B     10.0 B_pbe_v1.01.uspp.F.UPF
N     14.0 N.oncvpsp.upf
ATOMIC_POSITIONS crystal
B            0.6666666667       0.3333333333       0.7500000000
B            0.3333333333       0.6666666667       0.2500000000
N            0.6666666667       0.3333333333       0.2500000000
N            0.3333333333       0.6666666667       0.7500000000
CELL_PARAMETERS angstrom
     -1.2562141150      -2.1758266724      -0.0000000000
     -1.2562141150       2.1758266724       0.0000000000
      0.0000000000       0.0000000000      -7.7072650000
K_POINTS automatic
20 20 6 0 0 0
DOS Input:
&DOS
  prefix='hBN'
  outdir='./out/'
/
     highest occupied, lowest unoccupied level (ev):     3.1546    7.7535

!    total energy              =     -54.87830935 Ry
     estimated scf accuracy    <          5.8E-12 Ry

     The total energy is the sum of the following terms:
     one-electron contribution =     -27.98073829 Ry
     hartree contribution      =      21.53196044 Ry
     xc contribution           =     -18.59693952 Ry
     ewald contribution        =     -29.83259198 Ry

     convergence has been achieved in  11 iterations

  PWSCF        :   1m54.99s CPU   2m 1.43s WALL
Python script to plot the DOS:
import numpy as np
import matplotlib.pyplot as plt

for ws in [10]:         # This is the window size
    data = np.loadtxt('hBN.dos', skiprows=1, dtype='float')

    mov_avg_up = []
    arr_up = data[:,1]

    i = 0
    while i < len(arr_up)-ws + 1:
        window = arr_up[i : i + ws]
        avg = sum(window)/ws
        mov_avg_up.append(avg)
        i += 1

    fig,ax = plt.subplots(figsize=(15,10))

    plt.xlabel("Energy (eV)", fontsize=15)
    plt.ylabel("DOS (states/eV)", fontsize=15)
    plt.ylim(-.25,4)
    #plt.xlim(-50,50)

    fermi=3.235

    xval = data[int(ws/2)-1:int(-1*ws/2),0]

    ax.plot(xval-fermi, mov_avg_up, label="hBN DOS", linewidth=2, color='green')

    plt.title("DOS of hBN, PBE (moving average windows size="+str(ws)+")", fontsize=20)

    plt.fill_between(xval-fermi,0,mov_avg_up,where=(xval <fermi), facecolor='green', alpha=0.1)

    plt.axvline(x=0, linewidth=0.5, color='k', linestyle=(0, (8, 10)))
    plt.text(0.1, 1.7, 'Fermi energy', rotation=90, fontsize=15)

    ax.legend()

plt.show()
