4
$\begingroup$

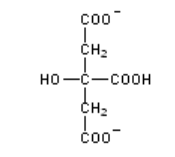
I've recently begun experimenting with drawing molecules from smiles expressions for use in an educational website. I am looking for a way to create simple structural representations of various molecules in metabolic pathways (Kreb's cycle, Gluconeogenesis, etc) in what I believe is Fisher projections (or similar?), as is often encountered in text books, for example the molecule Citrate:

Citrate Lewis

Since I'm creating my website in python I tried using rdkit but so far have only been able to create drawings with 110° angles.Citrate 110
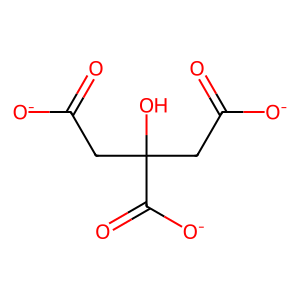
The smiles formula I used here is courtesy of pubchem:

C(C(=O)[O-])C(CC(=O)[O-])(C(=O)[O-])O

Is there any open source tool (preferably in python) that I could use to create images of the Fischer projections? Or is there a "trick" of how to do this with rdkit? I would be grateful for any help and please excuse if I have botched any of the terminology in question. Thanks!
$\endgroup$
0

1 Answer 1

5
$\begingroup$

I have created a python library called pychemprojections to create such visualisations of 2D molecule projections. (Made the first release an hour ago 😁)

It can be installed with pip like this:

pip install git+https://github.com/vandan-revanur/pychemprojections

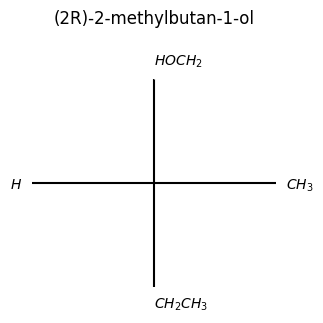
After installing, one can visualize Fischer projections, like this:

from pychemprojections.fischer.visualization import plot_fischer_projection
input_smiles_for_fischer = "[C@H](CC)(C)(CO)"
plot_fischer_projection(input_smiles_for_fischer)

This would output the following image:

enter image description here

The plot_fischer_projection only takes SMILES which contain one or more chiral carbon atom(s).

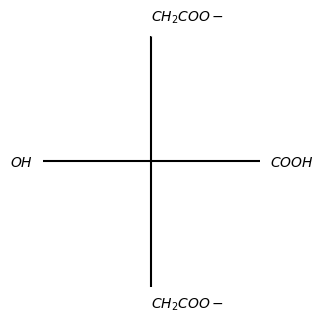
Therefore to visualise the Citrate molecule, one can do a hacky method as follows:

from pychemprojections.fischer.drawingclasses import SingleChiralFischerNotation, DrawingInfo
from pychemprojections.fischer.visualization import plot_fisher_projection_single_chiral_center

up = '$CH_{2}COO-$' 
right = '$COOH$'
left = '$OH$'
down = '$CH_{2}COO-$'
    
drawing_info = DrawingInfo(input_smiles='_', canvas_width_pixels=1000, 
canvas_height_pixels=1000, smiles_preprocessed="_", iupac_name="")
    
single_chiral_fischer_notation = SingleChiralFischerNotation(up=up, down=down, 
left=left, right=right)
    
plot_fisher_projection_single_chiral_center(
single_chiral_fischer_notation, 
drawing_info)

This outputs the following image:

enter image description here

Epilogue

Also the pychemprojections library has other projections implemented such as Newman projection, WedgeDash projection. Please do have a look and feel free to contribute in any way as outlined in the CONTRIBUTING.md

$\endgroup$

You must log in to answer this question.

Not the answer you're looking for? Browse other questions tagged .