11
$\begingroup$

I am simulating a droplet of water with GROMACS. The droplet consists of about 200 TIP3P water molecules and is placed near the center of a large, mostly empty box (so that it behaves like a free droplet in a vacuum, in spite of periodic boundary conditions. I had to do this as GROMACS2021 does not allow a simulation without PBC).

Now, I have to calculate the radial distribution function of the oxygen atoms and hydrogen atoms from the center of mass of the whole unit cell. However, I am not sure how to do this with gmx rdf. The documentation on the RDF module is minimal, and not clear at all.

I tried to run this:

gmx rdf -f md.xtc -s md.tpr -n index.ndx -o com-O.xvg -ref "com of group 0" -sel 3

In the index.ndx file, group 0 is System, group 3 is O atoms. However, this gave a graph that looks like this:

com-O rdf

The graph is very squiggly, and I expected a smoother graph.

I have also tried to use -ref 0 -selrpos dyn_mol_com but that gives a graph even more uneven.

So my question is what commands should I use with gmx rdf to get the rdf, and whether my graph looks ok or not?

Note: I have already gone through these two pages: gmx rdf and selection syntax and usage, but I cannot understand what they mean. Please don't redirect me to those pages!

$\endgroup$
4
  • 3
    $\begingroup$ +1. I don't have the answer for you, but I thought I'd link some related questions here. About RDFs in GROMACS: mattermodeling.stackexchange.com/q/3976/5, and about RDFs in general: mattermodeling.stackexchange.com/q/3852/5, mattermodeling.stackexchange.com/q/3624/5, mattermodeling.stackexchange.com/q/90/5. $\endgroup$ Commented Mar 15, 2021 at 23:01
  • $\begingroup$ Are you open to using other packages, like mdtraj or mdanalysis (both python)? $\endgroup$
    – lewiso1
    Commented Mar 21, 2021 at 23:09
  • $\begingroup$ @lewiso1 Do you mean other packages just for trajectory analysis, or the simulation itself? I can use any software for trajectory analysis, but the simulation has to be ran in gromacs. $\endgroup$
    – S R Maiti
    Commented Mar 22, 2021 at 11:24
  • 1
    $\begingroup$ I added an answer using numpy, but just realised you can probably get rid of the squiggliness by just reducing the binwidth. The droplet only has a radius of 1nm, which is quite small, so currently the RDF is way higher resolution than what you need and there's a lot of noise. Try adding -bin 0.15 to your gmx rdf $\endgroup$
    – lewiso1
    Commented Mar 23, 2021 at 0:26

1 Answer 1

9
+50
$\begingroup$

Here's an approach calculating it by hand with numpy. The coordinates are loaded from the trajectory using mdtraj in python:

#imports:
import mdtraj as md
import numpy as np
import matplotlib.pyplot as plt

#load trajectory:
traj = md.load('traj.dcd', top='solvated.pdb')
##You would write this:
##traj = md.load_xtc('md.xtc', top='top.gro')

#select oxygen atom indices:
oxy = traj.top.select('name O')

#calculate masses of all atoms:
masses = np.array([i.element.mass for i in traj.topology.atoms])


#iterate through all frames and save the distances of each atom to the centre of mass:
d = list()
for frame in traj.xyz:
    oxy_coords = frame[oxy]
    #COM of whole system:
    centre_of_mass = np.average(frame, axis=0, weights=masses)
    #COM of just the oxygens:
    #centre_of_mass = oxy_coords.mean(0)
    vectors = (oxy_coords - centre_of_mass)
    distances = np.linalg.norm(vectors, axis=1)
    d += list(distances)

##Take a histogram:
counts, lengths = np.histogram(d,bins=10)
#normalize 'counts' by averaging across the number of trajectory frames:
counts = counts / len(traj)
#calculate the volume of each spherical shell:
shell_volumes = 4/3*np.pi* ( lengths[1:]**3 - lengths[:-1]**3 )
#normalize 'counts' by the volume of each shell:
counts = counts / shell_volumes

#plot:
plt.plot( (lengths[:-1]+lengths[1:])/2, 
           counts , '-o' )
plt.ylabel('Number density per nm^3')
plt.xlabel('r (nm)')
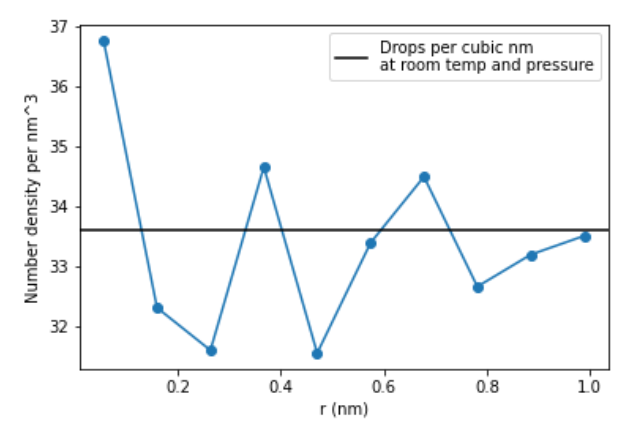
plt.axhline(33.6, label='Waters per cubic nm\nat room temp and pressure', c='k')
plt.legend()

I tried this on an example trajectory and it returns the graph below, which has number density ~33, which is what you would expect at room temperature and pressure. Note that I extracted a water droplet from a simulation of a periodic liquid system with a barostat, so your result will be different if you used a water droplet as the simulation system.

rdf

$\endgroup$
3
  • $\begingroup$ Thanks! One thing I noticed is the line centre_of_mass = oxy_coords.mean(0). I assume this means the centre of mass is being estimated by the oxygen atoms only? How do I also consider the hydrogen atoms because I want to use the precise centre of mass of the unit cell? $\endgroup$
    – S R Maiti
    Commented Mar 23, 2021 at 9:59
  • 1
    $\begingroup$ Sure - I edited the code to do this. The difference is you take an array of masses, and then when calculating centre_of_mass use np.average on all coordinates to find the mean coordinate, weighted by masses $\endgroup$
    – lewiso1
    Commented Mar 25, 2021 at 2:17
  • $\begingroup$ Your answer here was very helpful, could you please help me with this question too, if possible?: mattermodeling.stackexchange.com/questions/6291/… $\endgroup$
    – S R Maiti
    Commented Jul 1, 2021 at 8:57

You must log in to answer this question.

Not the answer you're looking for? Browse other questions tagged .