In my bachelor thesis, I compare simulated IR-spectra computed by different basis sets. The simulated spectra from sets like cc-pVTZ and cc-pVQZ are too similar to compare them by plotting them next to each other. That's why my supervisor asks me to create a differential spectrum from these spectra. I try to subtract one from the other, but the x-axes don't align, because I scaled them with different scaling factors. When I subtract them without scaling I get a similar result. In both cases, the miss alignment of the peaks results in a jump from positive to negative values and vice versa in the differential spectra.
I wonder if there is a way to create a differential spectrum from two simulated spectra computed with different basis sets.
Edit:
To give you a better understanding of my problem I upload my spectra. All spectra are not scaled with scaling factors.
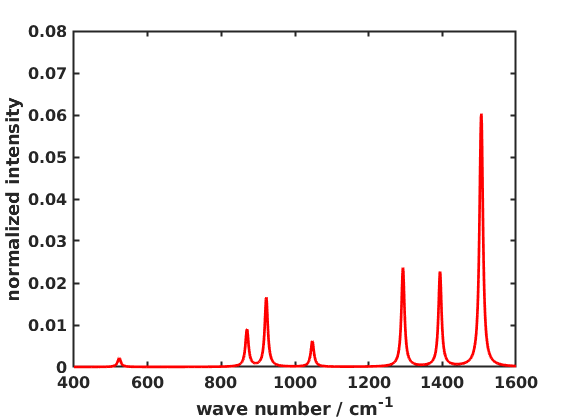
This spectrum (red) was computed with B3LYP/6-31G**.
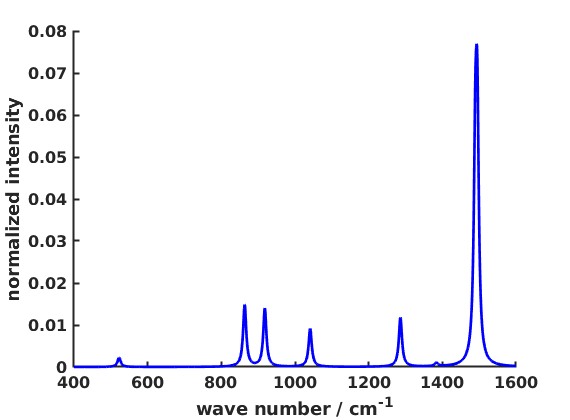
This spectrum (blue) was computed with B3LYP/6-311++G**.
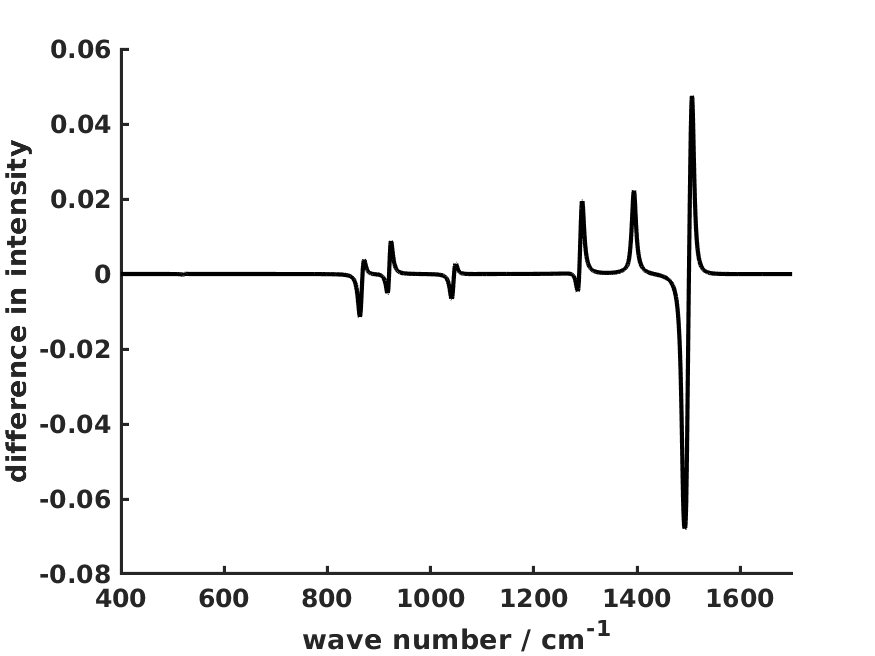
That was my try to subtract the blue spectrum from the red spectrum.
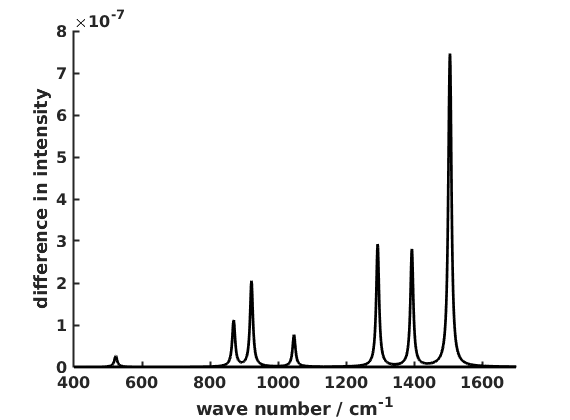
Here I divided the blue spectrum by the red spectrum like Cavenfish said.
I want to show how much higher or lower the intensity is in the red spectrum compared to the blue spectrum. In my understanding I should have intense peaks when the difference is high and peaks with low intensity when the difference between the peak intensities is small.
codeblock, along with what happens when you take the difference (whatever you explained in the question we would probably need to see). $\endgroup$