Motivation for Post: I saw a question about how to plot a .cube file recently on the Mathematica & Wolfram Language Stack Exchange. It was marked "off-topic," so I am asking a different (but related) question in the hopes it is on-topic here. Please refer me to the answer if it has already been solved. I have volumetric data I would like to plot in a custom manner (either in Mathematica, but preferably Python). But I have had issues up to this point. I am new to coding, and to Quantum-ESPRESSO (QE) which is how I produced my .cube file. I am not an expert in anything, merely a student trying to simulate some things.
Goals: Either with Python or Mathematica, (1) Generate a 3D plot of my volumetric data. (2) Be able to "slice" through that 3D graph with a user-defined plane to view a 2D cross-section. I would love to be able to create something inspired by VESTA's ability to do goals (1) and (2), but in a more customizable, flexible way to suit my needs. (I want to customize color mapping especially.)
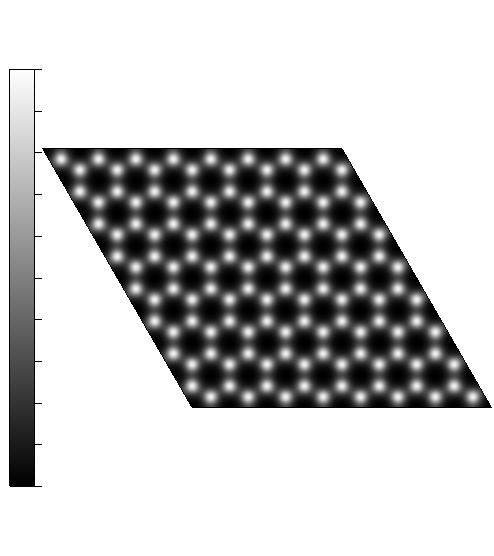
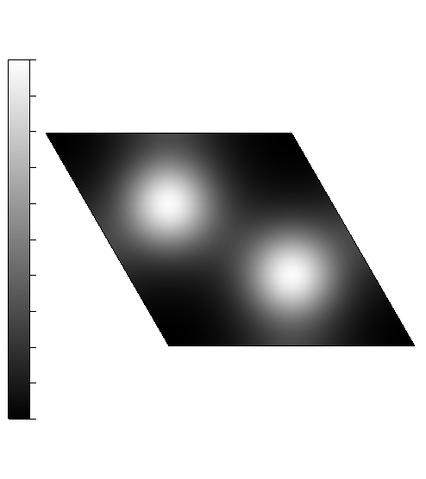
Produced by VESTA:
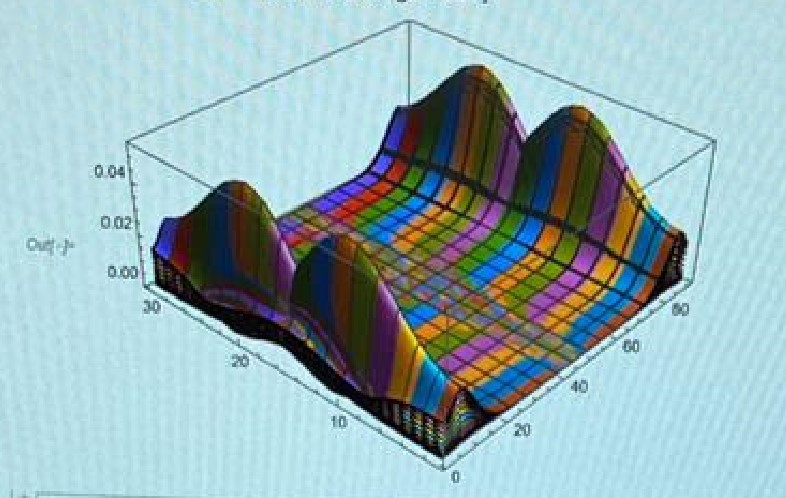
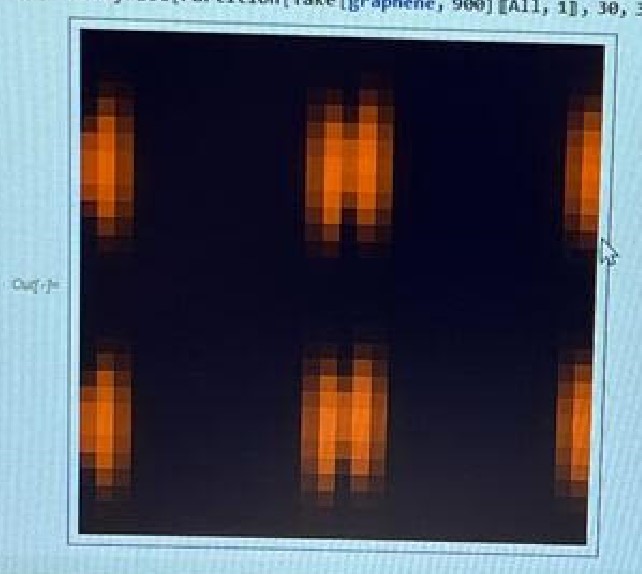
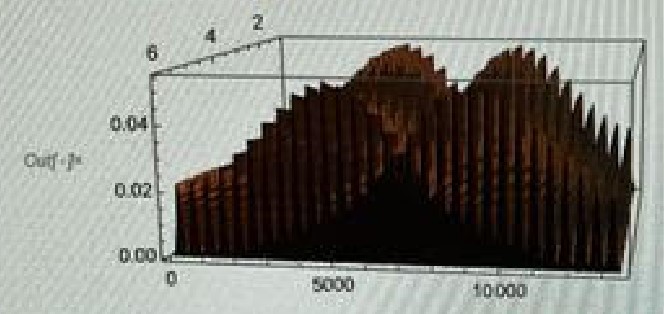
Attempts: Lots of failed attempts here. I even enlisted the help of a professional programmer who could not discern how the data was meant to be read, plotted, and/or modified. In one case, the voxels are not cubic; I would also like to be able to specify the voxel dimensions/spanning vectors. VESTA seems to be able to do this, but I want to do it from scratch so I can map the colors myself for figure-making and whatnot. Here is a failed attempt example. I will not include most here, as I wrote them on another computer.
Knowns:
This is how the data is listed: NX = 30, NY= 30, and NZ = 90. The output file has 6 columns (13,500 rows). (See https://gaussian.com/cubegen/) And each element corresponds to a 3D pixel (a voxel) and this volumetric data can be plotted in 3D. Then, I eventually need to take a slice/cross section of that. I am coming up with wacky plots.
Details for a specific case:
  Bias in eV =    -4.0817 # states  14
    2    0.000000    0.000000    0.000000
   30    0.155100    0.000000    0.000000
   30   -0.077550    0.134321    0.000000
   90    0.000000    0.000000    0.155133
    6    6.000000   -0.000000    2.686415   13.962000
    6    6.000000    2.326504    1.343207   13.962000
  0.55588E-05  0.34988E-04  0.11861E-03  0.24345E-03  0.39097E-03  0.54096E-03
  0.67531E-03  0.78084E-03  0.85041E-03  0.88243E-03  0.87942E-03  0.84643E-03
  0.78998E-03  0.71727E-03  0.63564E-03  0.55189E-03  0.47148E-03  0.39794E-03
  0.33282E-03  0.27609E-03  0.22697E-03  0.18457E-03  0.14835E-03  0.11800E-03
  0.93204E-04  0.73420E-04  0.57812E-04  0.45437E-04  0.35477E-04  0.27382E-04
  0.20868E-04  0.15779E-04  0.11943E-04  0.91091E-05  0.69791E-05  0.52905E-05
  0.38834E-05  0.27135E-05  0.18011E-05  0.11554E-05  0.73628E-06  0.46992E-06
  0.28540E-06  0.14217E-06  0.39326E-07  0.34955E-09  0.39326E-07  0.14217E-06
  0.28540E-06  0.46992E-06  0.73628E-06  0.11554E-05  0.18011E-05  0.27135E-05
  0.38834E-05  0.52905E-05  0.69791E-05  0.91091E-05  0.11943E-04  0.15779E-04
  0.20868E-04  0.27382E-04  0.35477E-04  0.45437E-04  0.57812E-04  0.73420E-04
  0.93204E-04  0.11800E-03  0.14835E-03  0.18457E-03  0.22697E-03  0.27609E-03
  0.33282E-03  0.39794E-03  0.47148E-03  0.55189E-03  0.63564E-03  0.71727E-03
  0.78998E-03  0.84643E-03  0.87942E-03  0.88243E-03  0.85041E-03  0.78084E-03
  0.67531E-03  0.54096E-03  0.39097E-03  0.24345E-03  0.11861E-03  0.34988E-04
  0.11671E-04  0.44003E-04  0.13569E-03  0.27204E-03  0.43228E-03  0.59398E-03
  0.73734E-03  0.84821E-03  0.91925E-03  0.94930E-03  0.94177E-03  0.90273E-03
  0.83954E-03  0.75996E-03  0.67161E-03  0.58146E-03  0.49513E-03  0.41637E-03
  0.34692E-03  0.28681E-03  0.23517E-03  0.19094E-03  0.15333E-03  0.12184E-03
  0.96098E-04  0.75528E-04  0.59316E-04  0.46516E-04  0.36275E-04  0.27993E-04
... etc
Question: Can someone please help me accomplish the two goals I laid out? It need only work for the specific case. If this specific case can work, I am hoping I can generalize it to other cases. Thank you so much in advance for any feedback, guidance, answers, or advice. I would love clarity on this issue and the file format.
