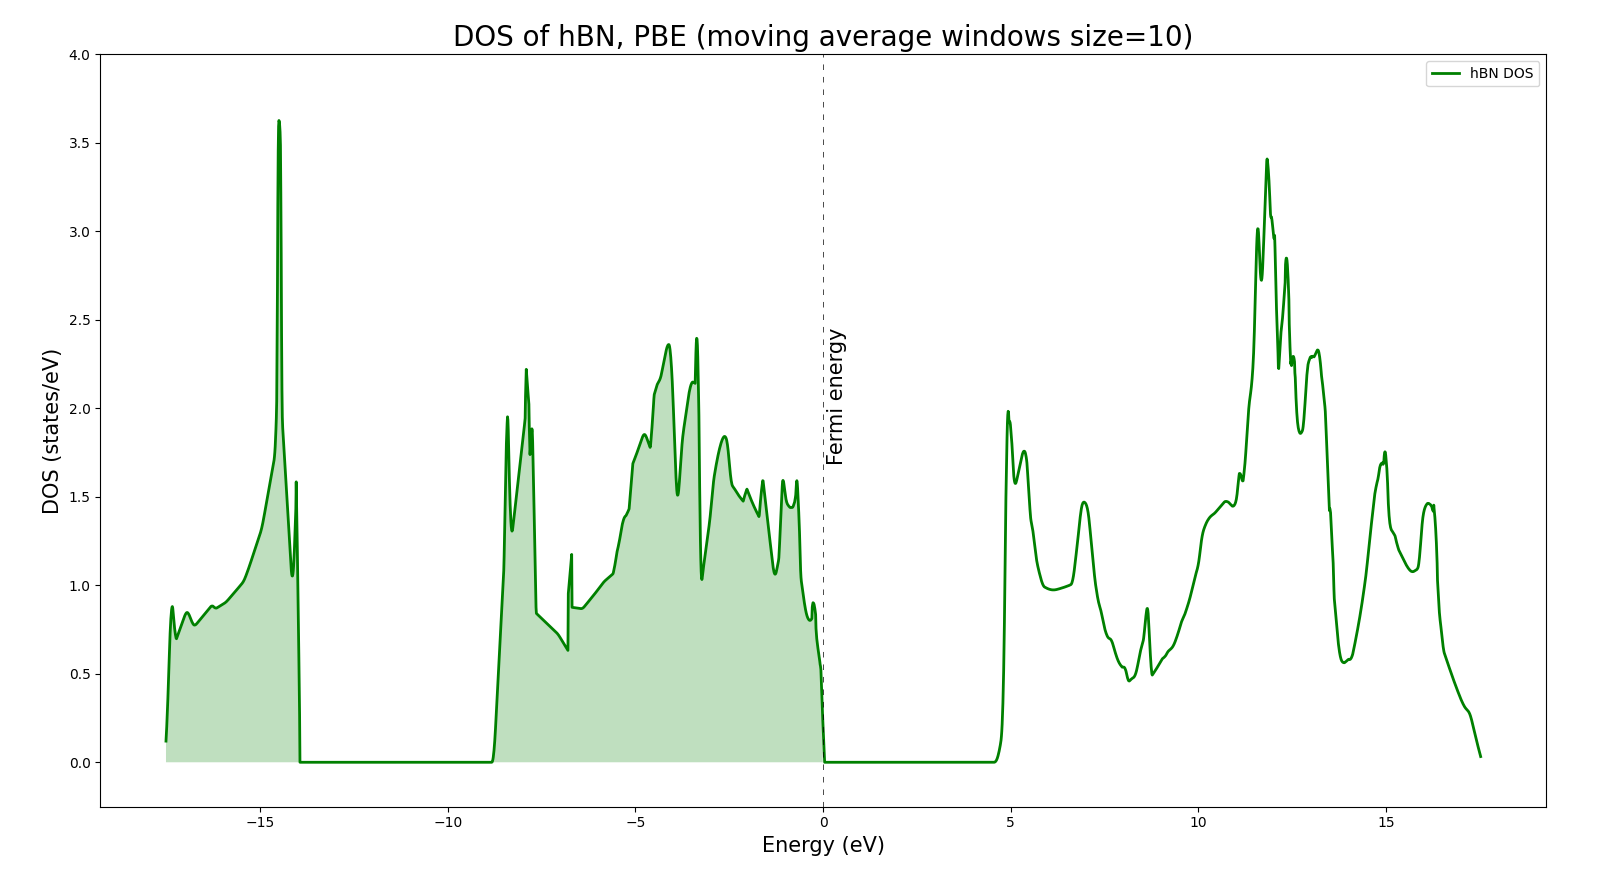
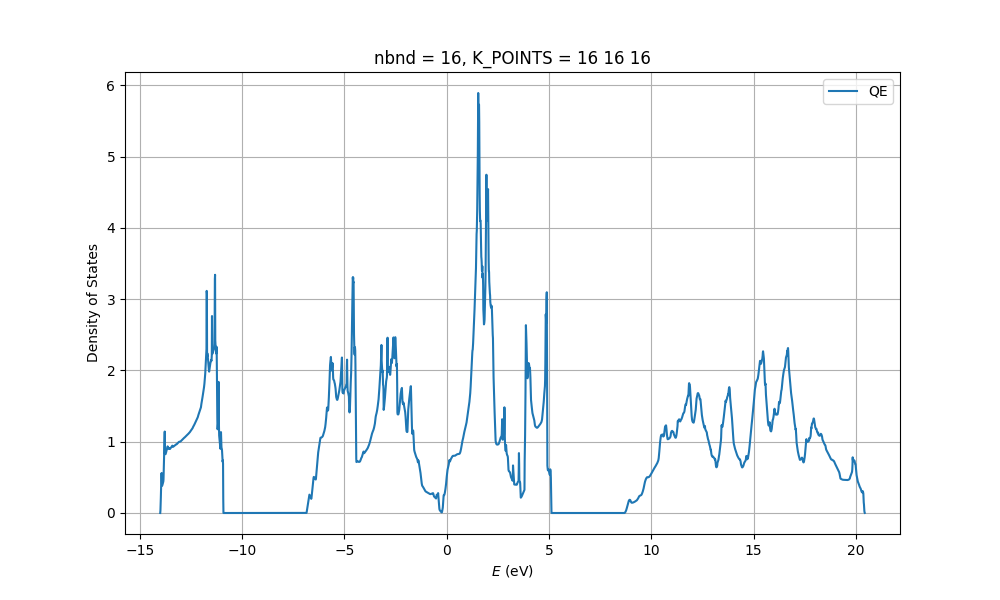
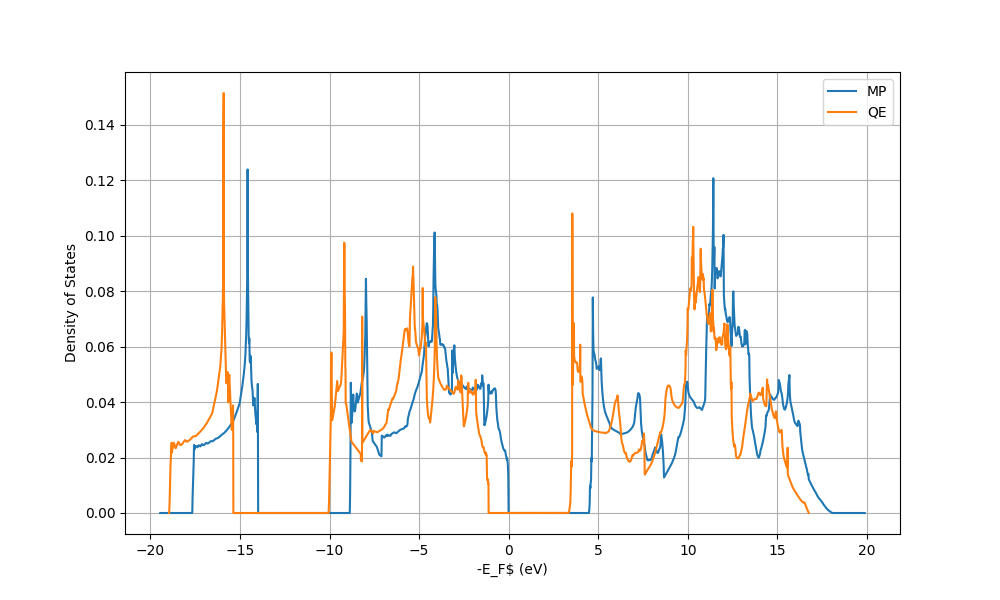
I have repeated your SCF calculation with SSSP precision pseudopotentials without doing any convergence testing and using the suggested minimum values. The input and the output files are attached at the end. But here are the results: the band gap is found to be 4.5354 eV as expected. The highest occupied and lowest unoccupied level are 3.1546 eV and 7.7535 eV. The DOS also seems to be correct. I arbitrarily set the Fermi energy in the highest occupied level since Fermi energy can be anywhere in the band gap in an insulator. So, your result seems correct to me but I just used a more strict set of parameters. I also use the nbnd parameter manually and occupations='fixed' in order to show the band gap in the output file of the SCF run. 
Input:
&CONTROL
  calculation = 'scf'
  outdir = './out/'
  prefix = 'hBN'
  pseudo_dir = '.'
/
&SYSTEM
  ecutwfc = 80
  ecutrho = 440
  ibrav = 0
  nat = 4
  ntyp = 2
  smearing='gauss'
  occupations='fixed'
  degauss=0.01
  nbnd=16
/
&ELECTRONS
  conv_thr =   1.0d-10
  !startingpot='file'
  !startingwfc='file'
/
ATOMIC_SPECIES
B     10.0 B_pbe_v1.01.uspp.F.UPF
N     14.0 N.oncvpsp.upf
ATOMIC_POSITIONS crystal
B            0.6666666667       0.3333333333       0.7500000000
B            0.3333333333       0.6666666667       0.2500000000
N            0.6666666667       0.3333333333       0.2500000000
N            0.3333333333       0.6666666667       0.7500000000
CELL_PARAMETERS angstrom
     -1.2562141150      -2.1758266724      -0.0000000000
     -1.2562141150       2.1758266724       0.0000000000
      0.0000000000       0.0000000000      -7.7072650000
K_POINTS automatic
10 10 10 0 0 0
NSCF Input:
&CONTROL
  calculation = 'nscf'
  outdir = './out/'
  prefix = 'hBN'
  pseudo_dir = '.'
/
&SYSTEM
  ecutwfc = 80
  ecutrho = 440
  ibrav = 0
  nat = 4
  ntyp = 2
  smearing='gauss'
  occupations='tetrahedra'
  degauss=0.01
  nbnd=16
/
&ELECTRONS
  conv_thr =   1.0d-10
  !startingpot='file'
  !startingwfc='file'
/
ATOMIC_SPECIES
B     10.0 B_pbe_v1.01.uspp.F.UPF
N     14.0 N.oncvpsp.upf
ATOMIC_POSITIONS crystal
B            0.6666666667       0.3333333333       0.7500000000
B            0.3333333333       0.6666666667       0.2500000000
N            0.6666666667       0.3333333333       0.2500000000
N            0.3333333333       0.6666666667       0.7500000000
CELL_PARAMETERS angstrom
     -1.2562141150      -2.1758266724      -0.0000000000
     -1.2562141150       2.1758266724       0.0000000000
      0.0000000000       0.0000000000      -7.7072650000
K_POINTS automatic
20 20 6 0 0 0
DOS Input:
&DOS
  prefix='hBN'
  outdir='./out/'
/
Truncated Output:
     highest occupied, lowest unoccupied level (ev):     3.1546    7.7535

!    total energy              =     -54.87830935 Ry
     estimated scf accuracy    <          5.8E-12 Ry

     The total energy is the sum of the following terms:
     one-electron contribution =     -27.98073829 Ry
     hartree contribution      =      21.53196044 Ry
     xc contribution           =     -18.59693952 Ry
     ewald contribution        =     -29.83259198 Ry

     convergence has been achieved in  11 iterations

  PWSCF        :   1m54.99s CPU   2m 1.43s WALL
Python script to plot the DOS:
import numpy as np
import matplotlib.pyplot as plt

for ws in [10]:         # This is the window size
    data = np.loadtxt('hBN.dos', skiprows=1, dtype='float')

    mov_avg_up = []
    arr_up = data[:,1]

    i = 0
    while i < len(arr_up)-ws + 1:
        window = arr_up[i : i + ws]
        avg = sum(window)/ws
        mov_avg_up.append(avg)
        i += 1

    fig,ax = plt.subplots(figsize=(15,10))

    plt.xlabel("Energy (eV)", fontsize=15)
    plt.ylabel("DOS (states/eV)", fontsize=15)
    plt.ylim(-.25,4)
    #plt.xlim(-50,50)

    fermi=3.235

    xval = data[int(ws/2)-1:int(-1*ws/2),0]

    ax.plot(xval-fermi, mov_avg_up, label="hBN DOS", linewidth=2, color='green')

    plt.title("DOS of hBN, PBE (moving average windows size="+str(ws)+")", fontsize=20)

    plt.fill_between(xval-fermi,0,mov_avg_up,where=(xval <fermi), facecolor='green', alpha=0.1)

    plt.axvline(x=0, linewidth=0.5, color='k', linestyle=(0, (8, 10)))
    plt.text(0.1, 1.7, 'Fermi energy', rotation=90, fontsize=15)

    ax.legend()

plt.show()


