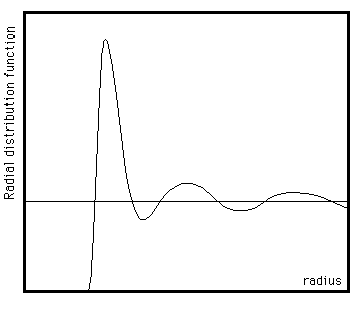
Your assumption regarding the RDF plot is generally correct. The RDF provides information about the probability of finding particles at a given distance from the reference atom/molecule. Analyzing the RDF plot can help identify significant changes or features, such as notable decreases in the RDF value or distinct changes in slope or curvature. In your case, it seems that you are interested in the first shoulder observed in the plot.
By identifying the point or range of distances where the RDF value decreases significantly, you can gain insights into the radius where the interactions between the surrounding atoms/molecules reduce greatly with the reference atom/molecule.
However, it's important to note that the RDF alone doesn't directly quantify the nature or strength of interactions. To obtain a more comprehensive understanding, I recommend examining the potential energy landscape, which provides information about the energy of the system as a function of atomic positions. Additionally, studying coordination numbers through techniques like pair potential or energy decomposition analysis can also provide insights into the interaction strengths and contributions from different components.
By combining these complementary analyses, you can enhance your understanding of the interactions in your system beyond what the RDF plot alone can provide.
