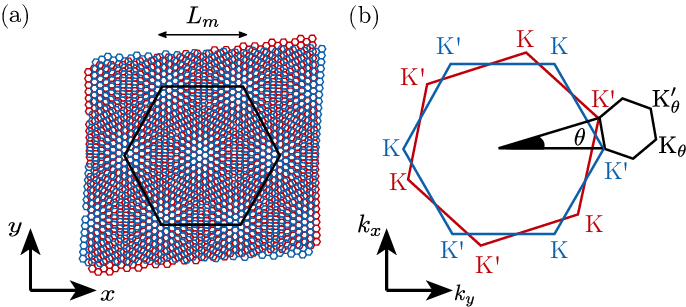
I want to produce some images related to graphene-like materials.
I was able to draw them using ASE visualize module after constructing the atomistic model. However the result is only sketchy and I want to add some other fancy things like different colors for atoms, vector arrows, bond lines, words and so on. Is it possible to do so, maybe integrating it with some other tools?
To give some reference, I would like to produce something like the first image in this:

If not, is there another software that can help me achieve this, without manually working with graphics primitives in a library like matplotlib?
Thanks