I use VESTA mostly for crystal structure visualizations.
What other options are available?
I use VESTA mostly for crystal structure visualizations.
What other options are available?
The Atomic Simulation Environment (ASE) has visualization capabilities. It is a python environment that allows direct interaction with a lot of atomistic simulation tools.
https://wiki.fysik.dtu.dk/ase/
Visual Molecular Dynamics (VMD) and XCrySDen are the two tools I personally work with the most time. They produce nice graphics and can visualize densities etc. VMD also has rendering capabilites by invoking e.g. PovRay.
https://www.ks.uiuc.edu/Research/vmd/
The Visualization Toolkit (VTK) and its graphical interface ParaView are capable of rendering truly stunning images and animations but have a rather steep learning curve.
I am sure there are a lot more options than this though.
I'm a big fan of simplicity and integration in my python-based and Julia-based workflow.
Therefore I typically directly use the visualisation features from pymatgen, such as pymatgen.vis.structure_vtk, and ASE, for example ase.visualize. Mostly I use them anyway to build up my problem. They have some features for analysing results as well, but those I have not used so far.
OVITO is a great tool for visualising supercells and simulation cells with a large number of atoms. There are plenty of modifications available that facilitate analysis, and it also has a Python interface for those who would like to work with scripts.
My favorite for working with inorganic crystals. But I moved to biomolecules several years ago, so I don't know how it compares with newer programs.
AtomEye has no menu. It is driven by pressing keys on keyboard. Mouse can be used for rotation, selection, etc, but surprisingly many things can be done with keyboard only.
It could handle millions of atoms from large-scale MD simulations, although I mostly used it for smaller configurations. AtomEye assumes that the system is under periodic boundary conditions (PBC) in a parallelepiped box. It's possible to shift the system under PBC (shift+mouse drag) - any atom can be moved to the middle of the PBC box. This was a useful feature I haven't seen in other programs.
Built-in coloring options were also nice - one can switch with a key press to coloring by coordination number or by sheer strain.
I don't have data at hand to make a nice screenshot. Looking into disk backup I found these pictures of SiC that were made with AtomEye:
For visualisation there's also a standalone Java application Jmol, which has a GUI and a more powerful command-line "console". I particularly like it for quickly visualising vibrational modes. However, it lacks tools to construct a simulation cell, unlike some of the other options people have mentioned.
For some applications there exists a elegant software called Olex2 which matches most of the crystallographic requirements of dealing with large systems like metal–organic frameworks.
Avogadro is generally considered to be a “molecular editor,” designed to construct and view molecules and materials in 3D. It's a cross-platform software. Even when its mainly used for constructing molecules, it's also useful for creating and visualizing unit cells and slabs.
These are some tutorials for constructing:
It can also generate input files for different DFT codes
Mercury is a specialized software to treat/manipulate crystal structures. It is part of the Cambridge Structural Database (CSD).
From Mercury's site, it allows you to:
- Generate packing diagrams, define and visualize Miller planes, and take slices through a crystal in any direction.
- Build and explore networks of intermolecular contacts to gain an understanding of the strengths and weaknesses of structures and identify the key interactions that drive crystal packing.
- Display space-group symmetry elements
- Calculate and display voids (free space in crystal structures) based either on contact surface or solvent accessible surface
- Perform molecule-based gas phase calculations via an interface to MOPAC
- Calculate intermolecular potentials and display e.g. the strongest user-defined interactions in the crystal structure
- View Bravais, Friedel, Donnay and Harker (BFDH) theoretical crystal morphologies.
The free version can be downloaded in this link (available for Windows, Linux and Mac) and the instructions to activate it are here.
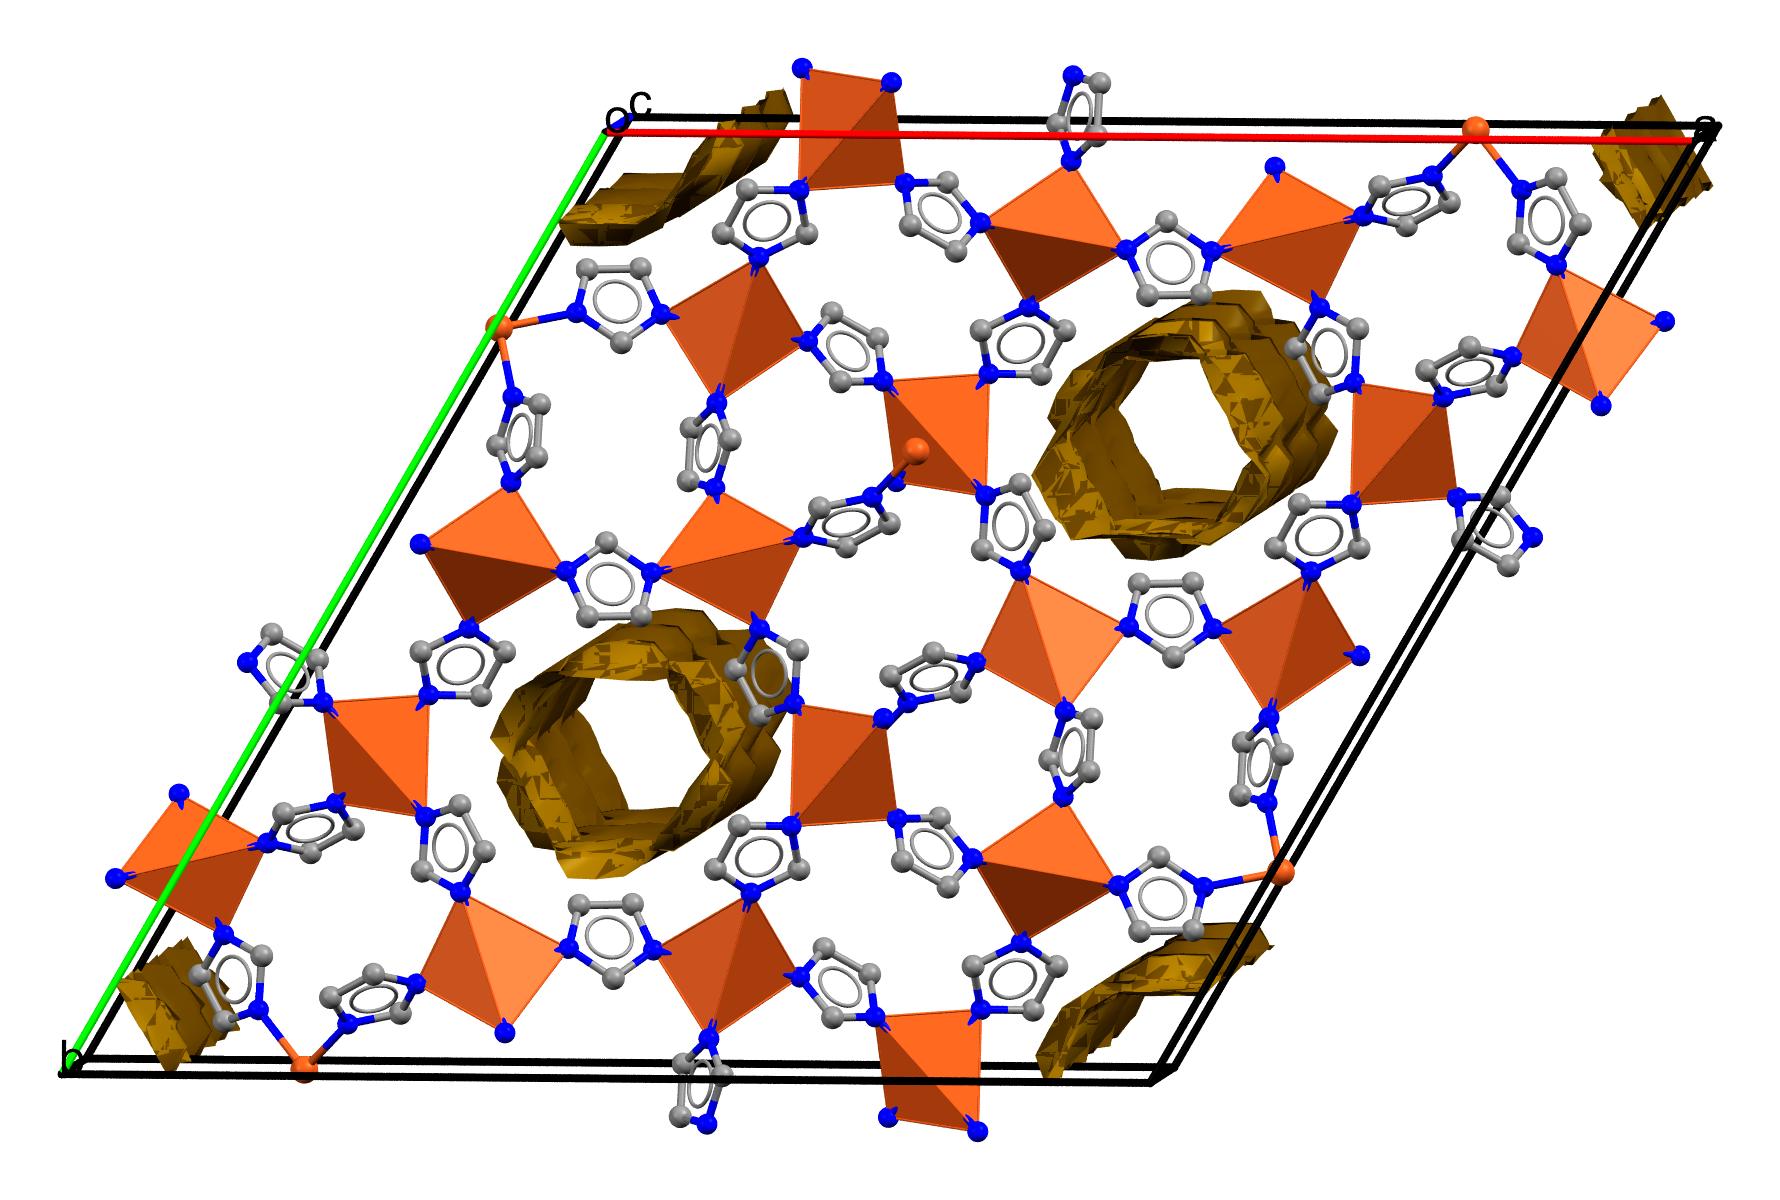
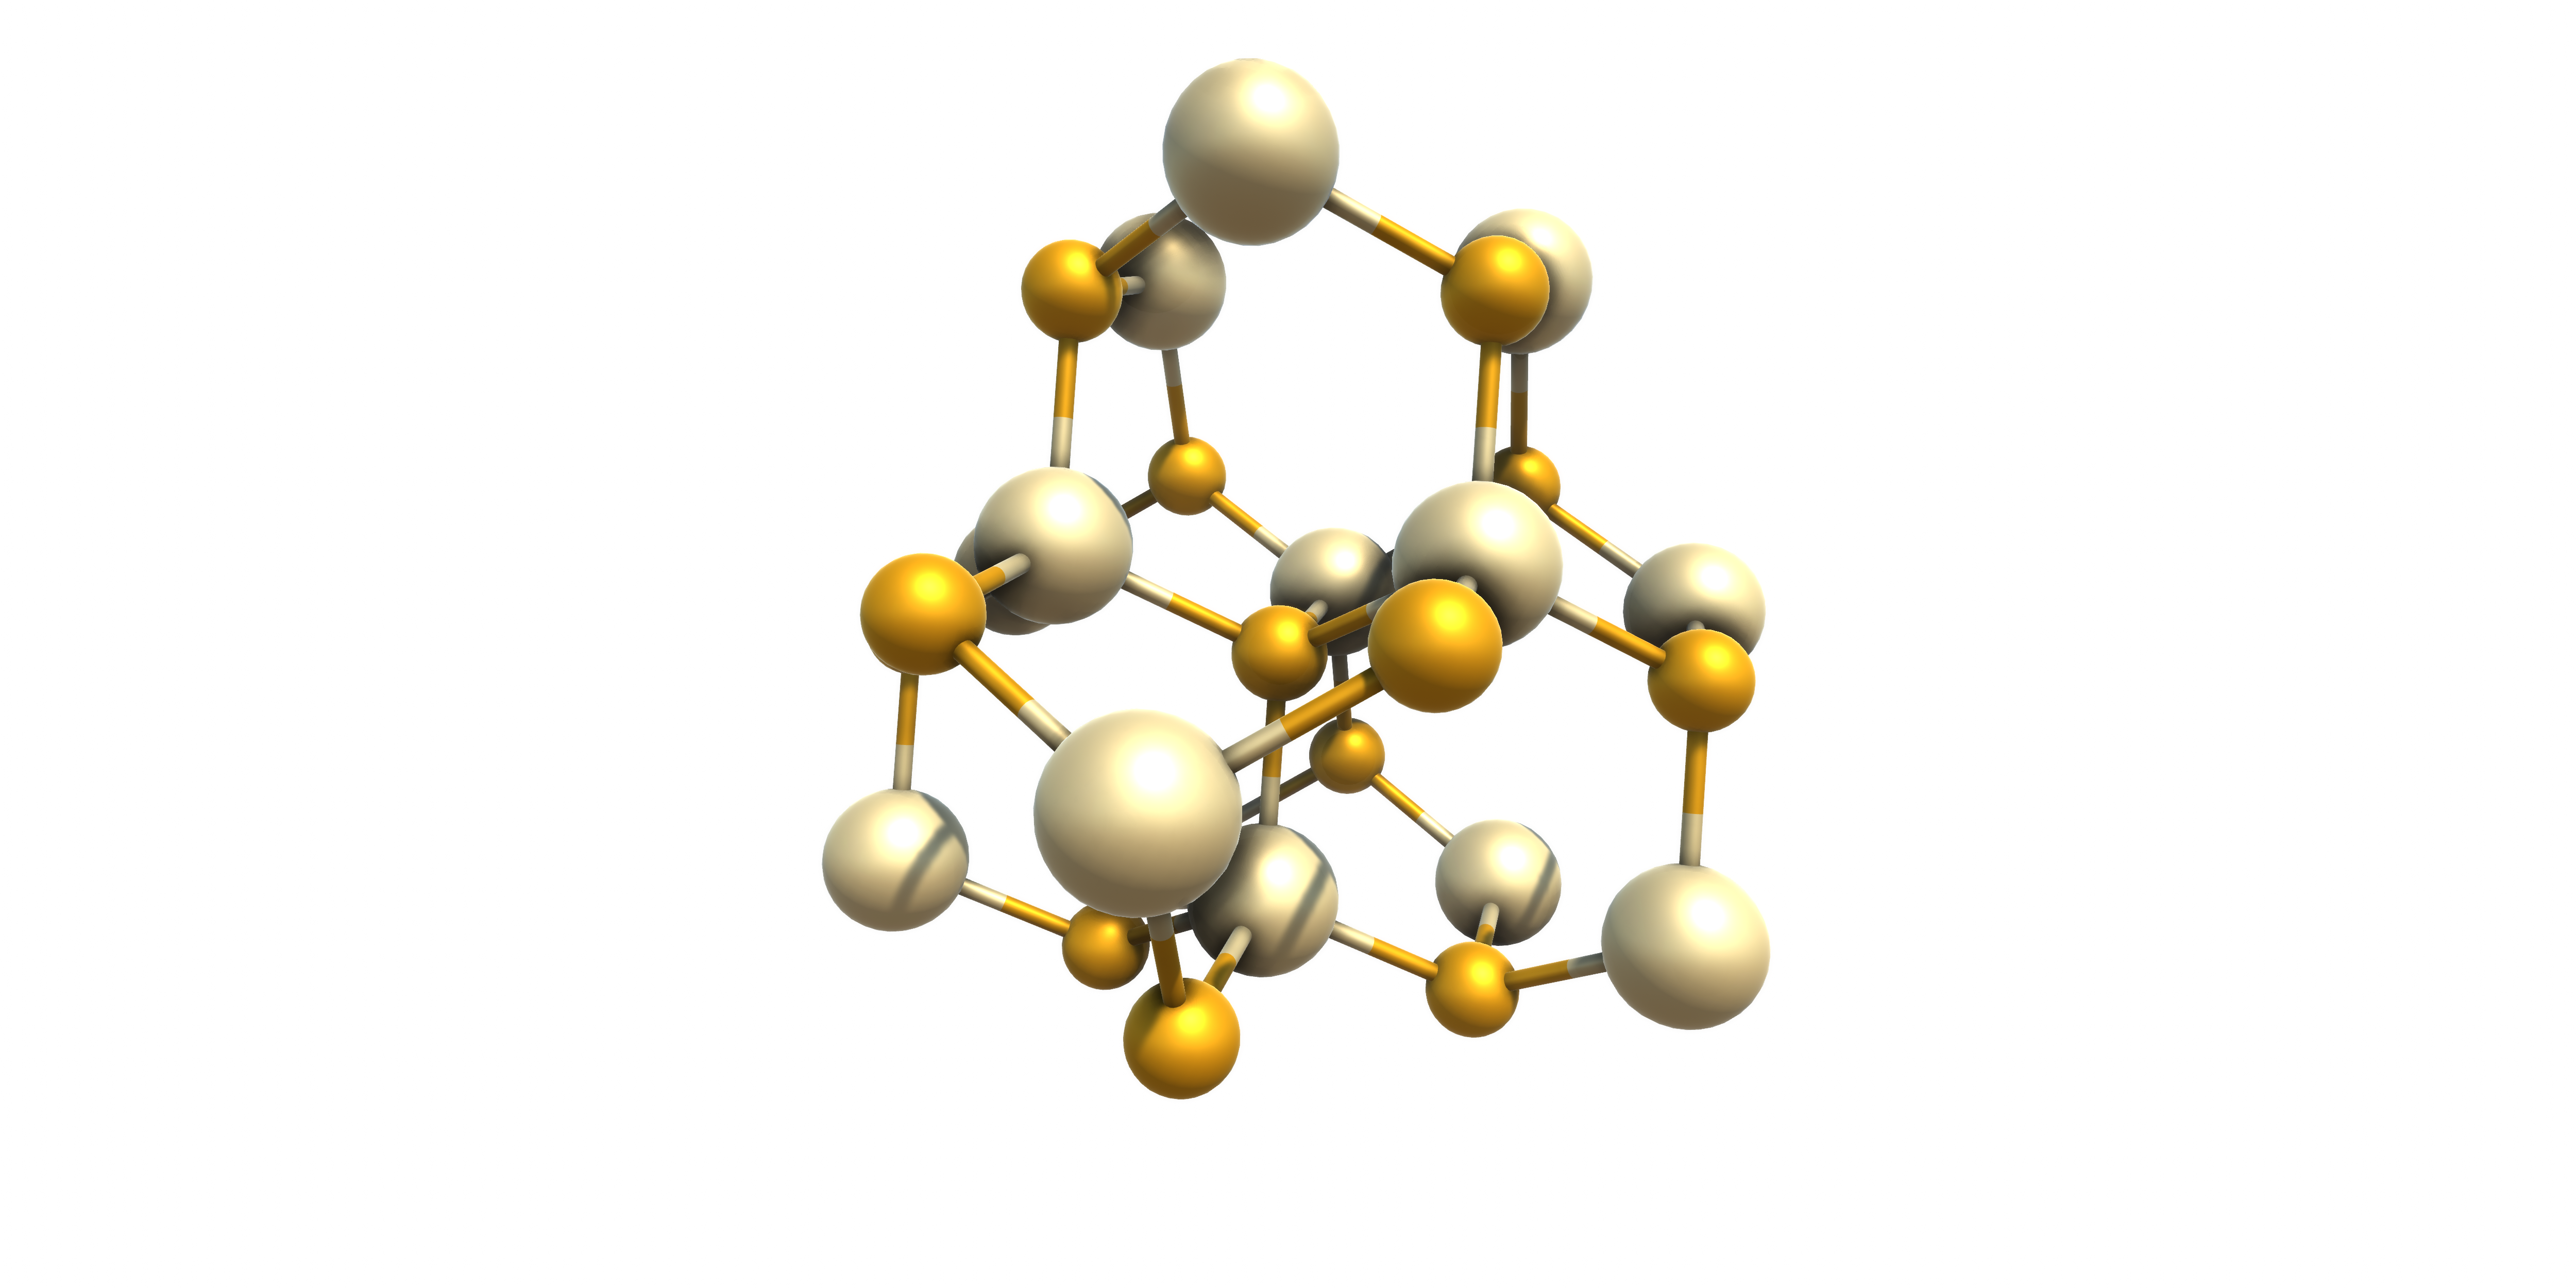
Two examples of images produced with it (from it's site):
Fig. 1. Refcode ASETEZ - Iron-molybdenum inorganic ring (shown with orange and blue polyhedra, respectively)
Fig. 1. Refcode CUIMDZ01, a polymorph of a copper imidazolate framework (often called a 'ZIF' that shows the copper polyhedra and channel structure of the void space

(source: cam.ac.uk)
fast & beautiful visualization of porous materials (but not only)
Features according to https://iraspa.org/iraspa/
- structure creation and editing,
- creating high-quality pictures and movies,
- Ambient occlusion and high-dynamic range rendering,
- collage of structures, (transparent) adsorption surfaces, text-annotation,
- cell replicas and supercells, symmetry operations like space group and primitive cell detection,
- screening of structures using user-defined predicates,
- GPU-computation of void-fraction and surface areas in a matter of seconds.
Official website:http://www.xcrysden.org/XCrySDen.html
XCrySDen is a crystalline and molecular structure visualization program aiming at the display of isosurfaces and contours, which can be superimposed on crystalline structures and interactively rotated and manipulated. It runs on GNU/Linux. It also possesses some tools for analysis of properties in reciprocal space such as the interactive selection of k-paths in the Brillouin zone for the band-structure plots and visualization of Fermi surfaces.
It can visualise chemical structures for the following ab initio simulation software:
Crystal Impact Diamond, despite being a commercial product, offers a free demo-version. One can import a structure, adjust its appearance and use screen capturing software for saving the image/animation.
Import of the following files is supported: DIAMDOC, DSF, EDF, DS1, CFG, CIF, CRY, CSD, DAT, PDB, ENT, INS, RES, DAT, IDF, KPL, XYZ, EMO, MOL, MOL2, MDL, CSSR.
From Diamond Help Library shipped with version 4.6.4 (stand 2014-10-28):
Limitations of the Demonstration Version
Note: It depends on the license file, whether Diamond runs in full or in demonstration mode (with the limitations mentioned below).
This article informs you about limitations of Diamond running in demonstration mode as compared with Diamond running as full version. This information is not valid for the full version of Diamond.
The demonstration version is identical with the full version except of the restrictions mentioned below:
In case of trouble when using Diamond, please pay attention to the following hints:
No saving
Changes in structure documents cannot be saved in the original file formats of Diamond versions 3 and 4 (the Diamond Document format, "diamdoc") and the Diamond Structure File format ("DSF"), which has been used by version 2 and 1.x of Diamond.
That means, whenever you call one of the functions that save the current structure document either with the "old" file name (File/Save) or with a new file name (File/Save as...), this will fail. Instead, a message box will remember you of this restriction.
Additionally, the function "File/Save all" is not available for this reason.
If you close a structure document window - either by closing the window, by using the "Close all" command from the "Window" menu, or by closing the application window of Diamond -, this will be closed immediately, even if the structure document has been changed or is new. That means, the usual prompt ("Save modifications in...?" - Yes/No/Cancel) will not appear!
The "Auto Save" function - which you can find on the Desktop tab of the Options dialog (Tools/Options) will not work, too.
"Diamond Demonstration Version" banner
A banner with "Diamond Demonstration Version" will be written into saved bitmaps, Windows Metafiles, and printouts.
You can try VESTA. It is good, lightweight and works on Windows and Linux platforms. It is good for viewing and production level image quality manipulation. https://jp-minerals.org/vesta/en/download.html
Beautiful Atoms is a Python package for editing and rendering atoms and molecules objects using Blender. A Python interface that allows for automating workflows.
Features:
Here are some nice pictures:
https://beautiful-atoms.readthedocs.io/en/latest/gallery.html
pip install moleviewmoleview your_file.xyzPDB, mmCIF, GRO, Mol2, XYZ and SDF files, OpenDX potential maps, XTC trajectory fileshttps://www.bragitoff.com/crysx-3d-viewer/
(Disclaimer: I am the developer of this software.)
The crystal visualizer tool is available for Windows, MacOS, Linux and Android devices. The visualizer enables the users to open popular .cif, .xyz, .cub, .mol, etc.format files to visualise crystal as well as molecular structures and isosurfaces. The visualizer is built using a gaming engine (Unity3d) ensuring stellar, never-before seen graphics on any other molecule/crystal visualizer. This makes the app really useful for researchers to prepare illustrations and figures for their research papers, thesis and dissertation. The app lets the users visualize lattice planes, and draw vectors to indicate electric/magnetic fields.


> before that section to format it as a quote. Also, if you have any affiliation with the product, it's always good to mention this.
$\endgroup$
Recently I found it hard to make the pymatgen structure_vtk visualization method to work. I believe it might be deprecated in favour of crystal_toolkit.
Another simple, fully Python based (Jupyter notebook) option is nglview, which can visualize pymatgen structures as well.
Additionally, nvc is an nglview wrapper for specifically visualizing crystal structures.
It works for quick inline visualization of structures.
3Dmol is rather easy to use https://3dmol.csb.pitt.edu/
It is easy to use in web on Jupyter notebooks
Multiwfn is an extremely powerful program for realizing electronic wavefunction analysis, which is a key ingredient of quantum chemistry.
Multiwfn is free, open-source, high-efficient, very user-friendly and flexible, it supports almost all of the most important wavefunction analysis methods.
Multiwfn is maintained by Tian Lu at Beijing Kein Research Center for Natural Sciences (http://www.keinsci.com). Multiwfn is always in active development, the original paper is J. Comput. Chem., 33, 580-592 (2012).
Here is the resource link: http://sobereva.com/multiwfn/