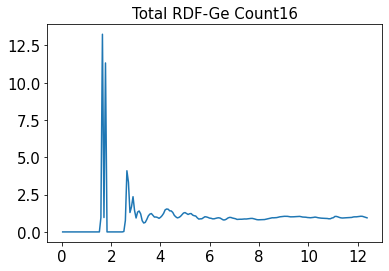
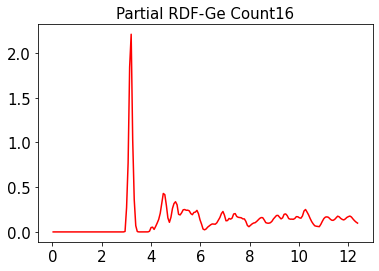
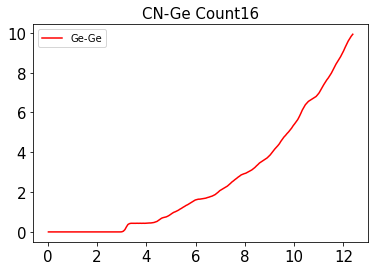
The link to the trajectory is here.I am using the module and similar code of the ASAP calculator from ASE. The problem is as follows, the running Coordination Number doesn't match the number of atoms in the cell.
Upon checking, I found that the ASE is reading the trajectory atoms boundary condition and cell correctly. But the results are this with 16 Ge-atoms in the cell. 


So, I am curious if someone can get the simple code below working,
from scipy import integrate
from asap3 import *
from asap3.analysis.rdf import RadialDistributionFunction
from ase.lattice.compounds import *
import matplotlib.pyplot as plt
import numpy as np
from ase.data import atomic_numbers, atomic_names, atomic_masses, covalent_radii

def rdf(file_traj, ge_ratio):
    print(file_traj)
    rMax = 12.41
    nBins = 200
    traj = Trajectory(file_traj)
    RDFobj = None
    for atoms in traj:
        #print(atoms.get_cell())
        if RDFobj is None:
            RDFobj = RadialDistributionFunction(atoms, rMax, nBins)
        else:
            RDFobj.atoms = atoms  # Fool RDFobj to use the new atoms
        RDFobj.update()           # Collect data

    x = (np.arange(nBins) + 0.5) * rMax / nBins
    rdf = RDFobj.get_rdf()
    plt.title('Total RDF-Ge Count%s'%ge_ratio, fontsize=15)
    plt.plot(x, rdf)
    plt.show()

   # Get the partial RDFs and plot them
    Si = atomic_numbers['Si']
    Ge = atomic_numbers['Ge']

    rdfGeGe = RDFobj.get_rdf(elements=(Ge, Ge))
    plt.title('Partial RDF-Ge Count%s'%ge_ratio, fontsize=15)
    plt.plot(x, rdfGeGe, 'r', label = "Ge-Ge")
    plt.show()

    y = rdfGeGe * 4 * np.pi * x * x * (ge_ratio/rMax**3)
    result_lst = []
    for i in range(len(x)):
        result = integrate.simps(y[:i + 1],x[: i+ 1])
        result_lst.append(result)
    result_lst = np.array(result_lst)

    plt.plot(x, result_lst, 'r', label = "Ge-Ge")
    plt.title('CN-Ge Count%s'%ge_ratio, fontsize=15)
    plt.legend()
    plt.show()
    return
.trajfiles are binary and Google Drive doesn't have a default way to display a generic binary file. $\endgroup$