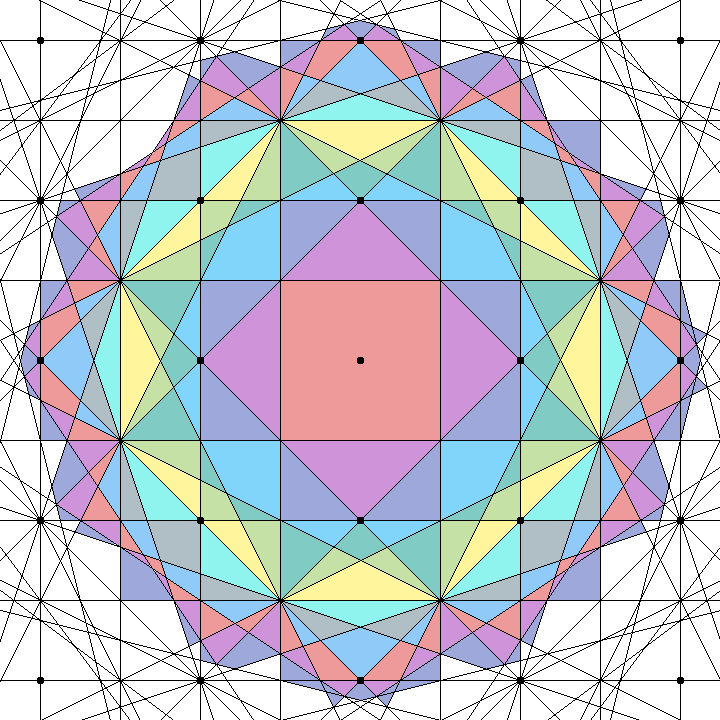
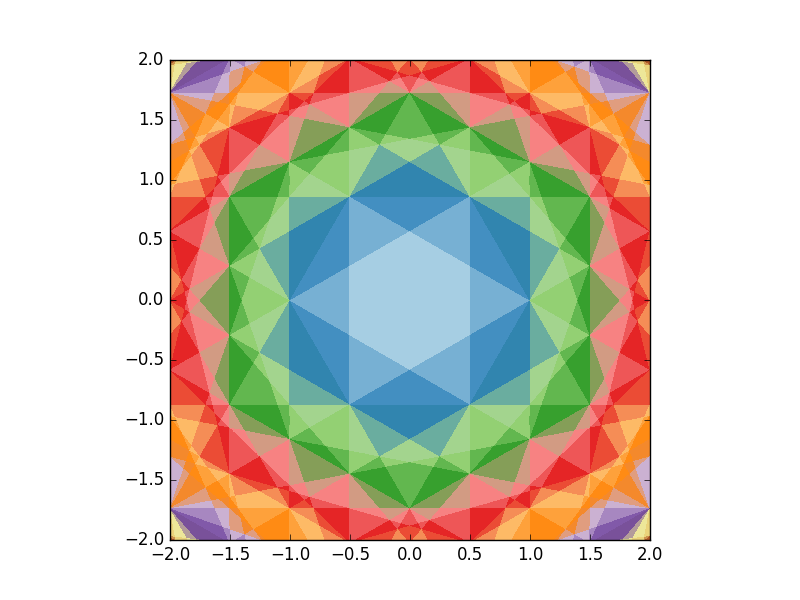
I am looking for a software or Python library to help me visualize higher-order Brillouin Zones (BZs) of standard lattices like FCC, BCC, etc. I have already plotted the first BZ of an FCC lattice using Voronoi decomposition from scipy.spatial.Voronoi, but I need assistance in plotting the second, third, or higher-order BZs.
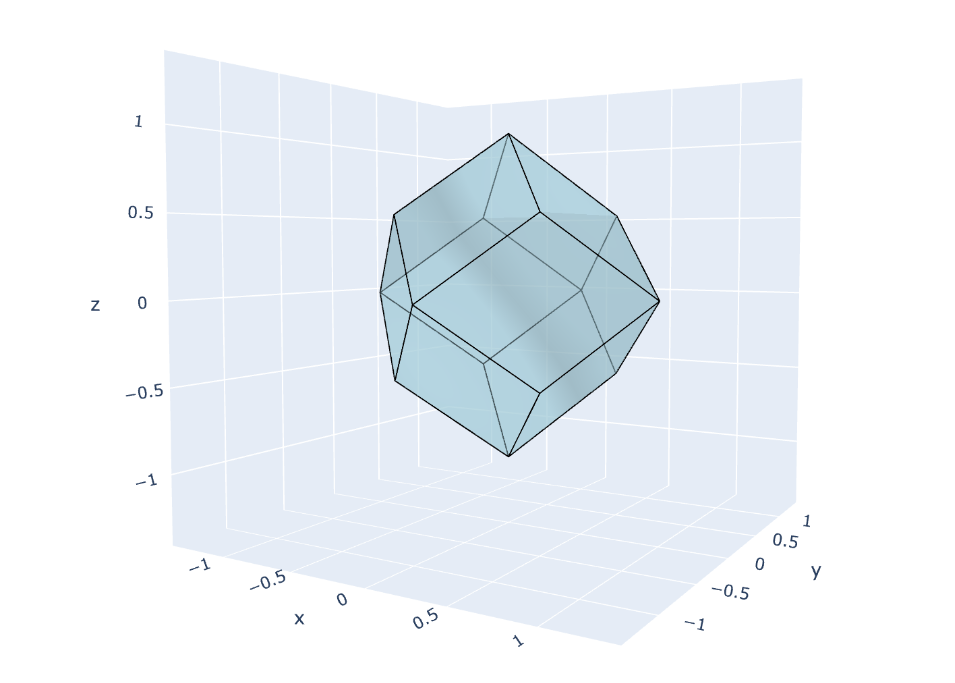
I have also included the code I used to plot the first BZ of a BCC lattice, a Rhombic Dodecahedron.
import numpy as np
from scipy.spatial import Voronoi
import plotly.graph_objs as go

# Defining the primitive basis vectors for BCC lattice
cell = np.array([[0.5, 0.5, -0.5],
                 [-0.5, 0.5, 0.5],
                 [0.5, -0.5, 0.5]])

# Computing the reciprocal lattice vectors
icell = np.linalg.inv(cell).T
b1, b2, b3 = np.linalg.norm(icell, axis=1)

# Generating the points for the Voronoi decomposition
px, py, pz = np.tensordot(icell, np.mgrid[-1:2, -1:2, -1:2], axes=[0, 0])
points = np.c_[px.ravel(), py.ravel(), pz.ravel()]

# Performing Voronoi decomposition
vor = Voronoi(points)

# Extracting the vertices, ridges, and facets of the Brillouin Zone
bz_facets = []
bz_ridges = []
bz_vertices = []

for pid, rid in zip(vor.ridge_points, vor.ridge_vertices):
    if 13 in pid:
        bz_ridges.append(vor.vertices[np.r_[rid, [rid[0]]]])
        bz_facets.append(vor.vertices[rid])
        bz_vertices += rid

bz_vertices = list(set(bz_vertices))
v = vor.vertices[bz_vertices]

# Creating vertices for Plotly surface plot
x, y, z = v[:, 0], v[:, 1], v[:, 2]

# Creating the surface plot
fig = go.Figure(data=[go.Mesh3d(x=x, y=y, z=z, color='lightblue', opacity=0.5, alphahull=0)])

# Adding edges to the plot
for edge in bz_ridges:
    edge_x, edge_y, edge_z = edge[:, 0], edge[:, 1], edge[:, 2]
    fig.add_trace(go.Scatter3d(x=edge_x, y=edge_y, z=edge_z, mode='lines', line=dict(color='black')))

# Setting axes range
fig.update_layout(title_text='1st Brillouin Zone of BCC lattice',
                  width=1000,
                  height=800,
                  scene=dict(
                      xaxis=dict(range=[-b1, b1]),
                      yaxis=dict(range=[-b2, b2]),
                      zaxis=dict(range=[-b3, b3]),
                      aspectratio=dict(x=1, y=1, z=1)
                            ),
                  showlegend=False
                  )

fig.show()


