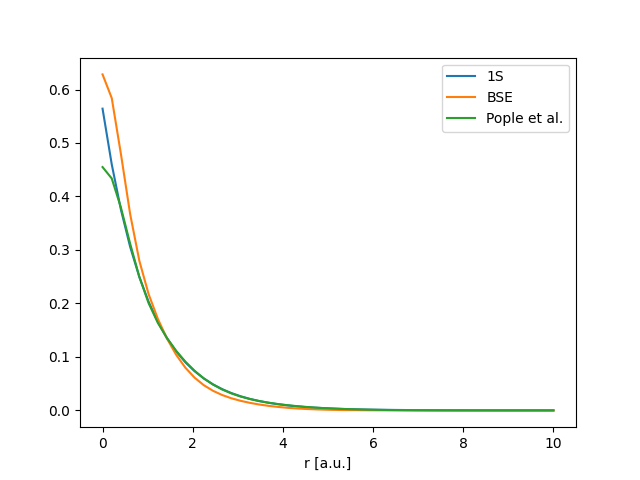
I am trying to work with the STO-3G basis set, but I noticed that the STO-3G in Basis set exchange is different from the STO-3G originally published, and not only that, the BSE version seem to be significantly worse. I am sure I am doing something wrong, can anyone please point out? (original references are provided in the python script)
Here are the plotted STO-3G functions and python script for plotting the analytical H1S and STO-3G functions:
import numpy as np
import matplotlib.pyplot as plt

#-------------------------------------------------------------------
# BASIS SET EXCHANGE STO3G H
# https://www.basissetexchange.org/basis/sto-3g/format/nwchem/?version=1&elements=1
# BASIS "ao basis" PRINT
# #BASIS SET: (3s) -> [1s]
# H    S
#       0.3425250914E+01       0.1543289673E+00
#       0.6239137298E+00       0.5353281423E+00
#       0.1688554040E+00       0.4446345422E+00
# END
# ------------------------------------------------------------------
def STO3G_BSE(x0,x):
    return \
        0.1543289673E+00 * (2 * 0.3425250914E+01/ np.pi)**(3/4) * \
        np.exp(-0.3425250914E+01*(x0 - x)**2) + \
        0.5353281423E+00 * (2 * 0.6239137298E+00/ np.pi)**(3/4) * \
        np.exp(-0.6239137298E+00*(x0 - x)**2) + \
        0.4446345422E+00 * (2 * 0.1688554040E+00/ np.pi)**(3/4) * \
        np.exp(-0.1688554040E+00*(x0 - x)**2)


#------------------------------------------------------------------
# Pople, Hehre and Stewart STO-3G 1S
# Hehre, W. J., Stewart, R. F., & Pople, J. A. (1969).
# Self‐Consistent Molecular‐Orbital Methods. I. Use of Gaussian Expansions of Slater‐Type Atomic Orbitals.
# The Journal of Chemical Physics, 51(6), 2657–2664. doi:10.1063/1.1672392
# Table 1
#------------------------------------------------------------------

def STO3G_PHS(x0,x):
    return \
        0.1543289673E+00 * (2 * 2.227660/ np.pi)**(3/4) * \
        np.exp(-2.227660*(x0 - x)**2) + \
        0.5353281423E+00 * (2 * 0.405771/ np.pi)**(3/4) * \
        np.exp(-0.405771*(x0 - x)**2) + \
        0.4446345422E+00 * (2 * 0.109818/ np.pi)**(3/4) * \
        np.exp(-0.109818*(x0 - x)**2)


# 1H 1S
plt.plot(np.linspace(0,10),1/np.sqrt(np.pi) * np.exp(- np.linspace(0,10)), label="1S")

# STO3G from BSE
plt.plot(np.linspace(0,10),STO3G_BSE(0., np.linspace(0,10)), label="BSE")

# STO3G from the Pople paper
plt.plot(np.linspace(0,10),STO3G_PHS(0., np.linspace(0,10)), label="Pople et al.")

plt.xlabel("r [a.u.]")
plt.legend()

plt.show()
