4
$\begingroup$

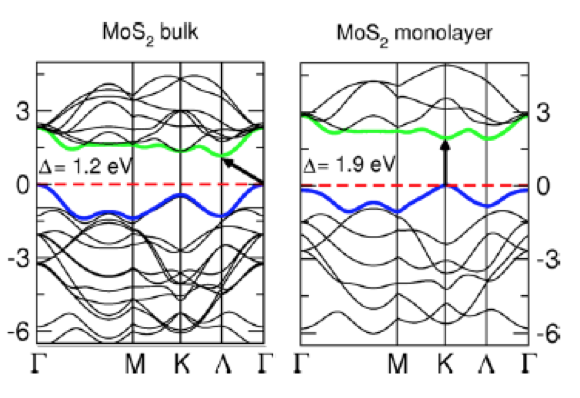
I want to understand the electronic band structure diagram of the following image, corresponding to $\text{MoS}_2$ (TMD):

enter image description here

I read about DFT (density functional theory).

DFT is based on solving the Schrodinger equation for a set of atoms. Through the Born Oppenheimer approach, it is possible to decouple the nuclear and electronic wave functions. We just then need to solve the Schrodinger equation for electrons. Using the two Hohenberg and Kohn theorems, we obtain the Kohn Scham equations: $$\bigg[-\frac{\hbar}{2m}\nabla^2+V(r)+V_H(r)+V_{XC}(r)\bigg]\psi_i(r)=\epsilon_i(r)\psi_i$$

Computationally the problem is solved as follows:

-Define n[r] (random)

-Solve Kohn Scham equation and find $\psi(r)$

-Calculate new n(r): $n(r)=2\sum\psi^{*}(r)\psi(r)$

-If n(r) calculated is equal to the original, the program will stop. If they're different, the program recalculate the Kohn Scham equation with n(r) calculated previously.

According to Hohenberg and Kohn's theorem 1, each electronic density uniquely corresponds to an energy in the ground state, therefore, once the program ends, knowing the electronic density, we know the energy in the ground state.

I don't understand how DFT relates to the various lines obtained from the graph and I don't understand what DFT is related to orbitals. How was the graph obtained based on the DFT?
$\endgroup$
0

1 Answer 1

5
$\begingroup$

Started as a comment, turned into an answer. Someone else can give more detail and precision in the explanation, but here I'll just give a rough sketch of the general idea.

I think you may have conflated $\psi$ with the system wavefunction. In the Kohn-Sham equations, $\psi_i$ is an orbital and $\epsilon_i$ the energy of that orbital. Going from a molecular case to a periodic system, we can think of combining the orbitals of the monomers to create a crystal orbital, but this crystal orbital and its energy will depend on how we align the phase of the monomer orbitals.

The band structures in your post depict just that: each band corresponds to a monomer orbital and the band gives the energy of the crystal orbital (y-axis) with respect to the phase arrangement of the monomer orbitals (x-axis). The symbols on the x-axis are labels for particular points in k-space that define the phase with which the orbitals combine. For example, the $\Gamma$ point is the origin in k-space and corresponds to each monomer orbital having the same phase in the crystal orbital. Another point might mark that the phase of the orbitals changes by $\pi/2$ for each monomer unit.

$\endgroup$
2
  • $\begingroup$ Nice answer. I have a peripheral question in mind. I have observed that, in spite of large forces and/or pressure present, the electronic band dispersion of a 2D slab model structure (unrelaxed w.r.t. new pseudopotential used) matches very well with the reported bandstructure. In such cases, can these residual forces and stress for these computationally exfoliated 2D materials be ignored (at least in slab model)? $\endgroup$
    – AbPhys
    Commented Dec 3 at 12:39
  • 1
    $\begingroup$ @AbPhys I would be skeptical of large residual forces, but I don't work extensively with solid state calculations. It would be best to post this comment as a separate question, where I imagine it will be seen by more people familiar with 2D slab modelling. $\endgroup$
    – Tyberius
    Commented Dec 3 at 14:34

You must log in to answer this question.

Not the answer you're looking for? Browse other questions tagged .