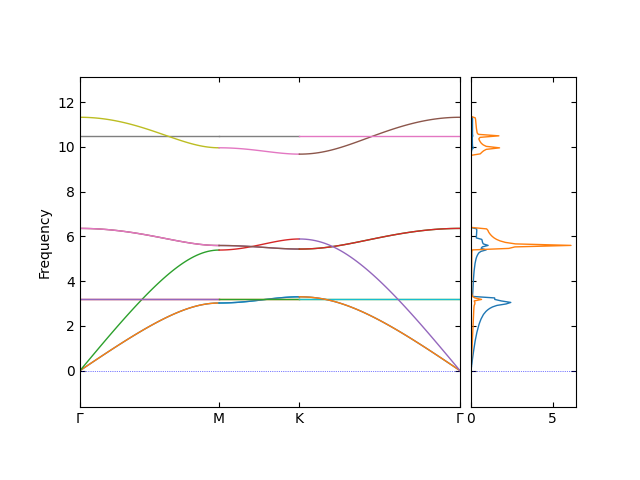
In my phonon calculation utilizing DFPT in VASP for a monolayer material with space group 187, I've noticed that while most of the phonon bands are positive, two of them appear to be straight. What could be the explanation for this observation?

Such bands are usually called 'flat bands'. The group velocity vanishes, signalling that such an excitation is non-dispersive, i.e. is localized. See here. Think 'molecular modes'. For an isolated molecule, $\omega(k) \equiv \omega$ is independent of $k$, thus is flat. The oscillations are not wave-like but are localized.
In many cases, flat bands in a crystal are interesting. However, rarely is a band in a real crystal truly flat. They are usually 'flattish' at best. Maybe there is something wrong with your calculation?
As a check, I suggest visualizing the displacements of the flat modes. I usually use this online tool.
Since you have used VASP-DFPT, I assume you used the interface to phonopy. Did you use a supercell? Even with DFPT in VASP, you have to use a supercell. If not, you are only sampling the zone-center and the Fourier interpolation of a single point can be anything. See my comment on this wrong answer. The VASP DFPT routines only do $q=\Gamma$ and you must use a supercell. Even the phonopy documentation uses a supercell. $q \neq \Gamma$ is supposed to be added in one of the 6.* versions, but is not working as far as I know.